This video explains how GPAs and credits are calculated in KEYSTONE.
GPA Primer
In a Nutshell
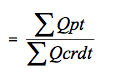
GPA = Total Quality Points divided by the Total Quality Credits
Grade Point = the value of a grade, usually expressed on a 4.00 scale
Quality Points (Qpt) = the value of a grade (the grade point) x total number of credits for the course
Quality Credits (Qcd) = number of credits for a course that a student receives a grade
Weighted Grade Point = A bonus added to a regular grade point for higher levels of courses, such as Honors, AP or IB.
Groundwork
If the above makes intuitive sense, hooray, skip on to the next section! If not, fear not, here is an English explanation, step-by-step.
First, a Grade Point Average is an average of grade points, not just grades. This is an important distinction. The concept of averages should be pretty easy. The trickier aspect is this business of Grade Points. But first, let’s consider the following:
If you took 3 classes, Math, English and History, and received grades of 80, 90 and 100 respectively, your average grade for the three classes would be 90. No sweat. The world would be such a better place if the story ended here, but unfortunately, the plot thickens.
What if the English and History classes were both full academic courses, but your Math class was an elective? Should you still have the same grade average? You may be getting a poor bargain here since the 80 you received in the elective course, Math, is given the same weight as the full academic courses.
Clearly, taking three year courses is not the same as taking two year courses and one semester course. Worse yet, what if someone else who took the same three courses received a 100 in the Math elective, a 90 in English and an 80 in History. A straight average of his grades would give us 90, but it seems a little unfair that this fellow should be considered your equal despite doing more poorly in the academic courses and only marginally better in the elective.
Here, you might wonder, “Aha! If we simply consider each grade with its weight, wouldn’t it solve the problem?”
That is exactly so. In other words, we need to qualify each grade by the weight of that grade. In colleges and universities, frequently, courses are measured in terms of units, credit hours or credits, or simply hours. For example, Calculus 101 may be a 2 credit hour course but Advanced Basket Weaving is only worth 1 credit hour. In primary and secondary schools, these weights are most frequently called credits or units. For simplicity, I am going to use the unit measure, credit, to refer to the weights of courses. To qualify a grade, we multiple the grade value by its credits to get a number which is also known as quality points.
So, let us recall our course load from above. In our case, English and History may be worth 2 credits while our Math elective is worth 1 credit. Our Math grade is now really only worth 80 quality points (80 x 1 = 80), English is now worth 180 quality points (90 x 2 = 180), and our History grade is worth 200 quality points. The total number of quality points for our three classes is, 80 + 180 + 200 = 460.
Now, to get the average of these quality points, we just can’t divide by the number of actual classes (3) since they don’t all have the same weight. Instead, we need to divide by the total number of credits for the three courses, which is 1 + 2 + 2 = 5
Table 1. Number Grades, Credits & Qpts
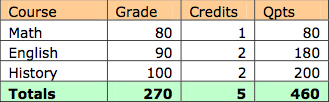
Therefore, the average of our grade points—our GPA— on a 100 scale is 92 (460 divided by 5). 92 on a 4.00 scale would equal 92/100 x 4 = 3.68
Letters to Numbers
In most US public and independent schools, the convention is to evaluate student performance using a letter grade system. Never mind the inherent issues around interpreting funny numbers such as 3.82 or the debatable merits of artificially quantifying a subjective evaluation—we must set aside the pedagogical issues for the moment. Our convention compels us to arrive at a Grade Point average from letter grades such as A, B+, C, D-, F, etc. To do this we need a letter-to-number translator to give us a grade point equivalent for each letter grade.
Here is an example of a grade point equivalent table for letter grades to a standard 4.00 scale. Note that A+ is typically considered a 4.00, that is the best a student can do on a 4.00 scale is a 4.00; but some schools turn an A+ to a 4.33. I don’t make the rules.
Table 2. Letters to Grade Point Equivalent
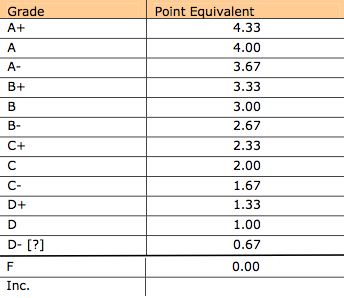
Table 3. Letter Grades, Num equivalents…

Using the same three courses from the previous example, let’s award a B- to Math, an A- to English and A to History. See the table above. Although we know the weight of each course (credits), that alone isn’t sufficient for a GPA. We will need to convert the letters to some numeric equivalent by consulting (looking up) our conversion table (Table 2).
Once we have happily determined the number equivalent of these grades, the GPA calculation is a simple matter of totaling up the quality points (18.01) and dividing by the sum of the credits for the courses (5). This gives us a GPA of 3.60.
Something Smells Funny…
Did you notice that something odd? Something is definitely rotten in Denmark! In the first example, using plain number grades on a 100 scale, our GPA was 3.68 but the ‘same’ grades as letter grades turn out to be 3.60. The two are not equal! How did this happen?
Despite the conventional wisdom, there is no such thing as a standard GPA calculation. In schools where teachers report grades as letters, the letters represent the final composite of all subjective and objective evaluations. All internal scaling, curves, extra-credits, fudge-factors and inflationary or deflationary practices have been reduced to a single symbol before that symbol in turn becomes pegged to some objective measure. Exactly what each letter grade means remains the illusive question considering that methods and standards of evaluations from class to class, from teacher to teacher could be as different as the subject matters taught in these classes. As if this weren’t problematic enough, we have yet to consider the wide latitude of arithmetical treatments that can be applied to something as innocent as a B+. Teachers, schools and even districts may use different conversion scales: one school may consider a B+ to be a 3.30 while another, a 3.33. For that matter, they may round each quality point before totaling them up, or round after totaling them up.
Schools where teachers report grades on a 100 point scale have the added burden of deciding whether to compute GPAs on the raw numeric grades or on their ‘equivalent’ grade point conversion. Ignore for the moment that in either case, that school would be making a unilateral interpretation of the difference between something like an 84 versus an 85. It is arguable that doing grade point conversions on numeric grade ranges, say convert any grade in the range of 85 to 89 is a 3.00, conforms better to convention. After all, teachers that report letter grades would convert numeric marks to letter grades or point scale equivalents.
This entire exercise may seem mildly absurd and it is dubious if there such thing as a ‘correct’ system, or for that matter, a standard one. Ours not to reason why, ours but to do or die. In the vacuum of consensus around the purpose or the function of GPAs, and in the absence of good and reliable context for interpreting them, they could be potentially injurious. [link to unwritten paper on the conundrum of measuring performance]
Weighted GPAs
The business of giving extra weight to grade points is equally fraught with problems. But, we will leave the discussion for another time. In practice the idea is to increase the grade points to reflect higher class levels. For example, an A in ‘regular’ English class might be a 4.00 but an A in an AP English class might be worth 5.00. To my knowledge, there is little consensus among schools regionally or nationally on these extra weights with one exception:
The University of California schools have adopted a uniform GPA and weighted GPA guidelines, which is summarized in the table below:

Here is a sample GPA table based on the UC GPA system:

GPA (total Qpts / total Credits) = 3.71
Term-Grade Based vs. Final-Grade Based GPA
It is possible to calculated GPAs on a term grades rather than on the final course grades. There are a number of reasons for this approach but typically, schools compute GPAs by term if they do not issue final course grades and must rely on the term grades instead.
Here is an example of a weighted, term based grade point table using the UC point conversion scale:
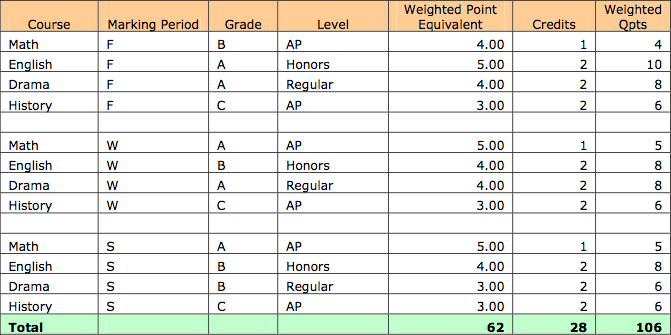
Weighted Term based GPA = 3.79
Cumulative GPA
A cumulative GPA (cum GPA) is the grade point average (either on a term basis or on a final- grade basis) to date. This includes the grade points based on most recent grading period for students’ current classes. Cum GPAs that are reported to colleges for current seniors in high school would typically include their grades from the first semester of their senior year.
References
Downs, Gail C. (2000), A Conundrum for Secondary Schools, by Gail C. Downs, M.S.,Center for Research and Evaluation, a publication of the College of Education & Human Development at the University of Maine
Ashenfelter, J.W. (1990). Our schools grappled with grade-point politics and lost. Executive Educator, 12 (1), 21-23.
Cognard, A.M. (1996). The case for weighting grades and waiving classes for gifted and talented high school students. (Report No. RM96226). Storrs, CT: National Research Center on the Gifted and Talented. Available online: http://www.gifted.uconn.edu/cognard.html
Lockhart, E. (1990). Heavy grades. The Journal of College Admission, 126, 9-16
Manzo, K.K. (1998, June 17). Weighted grades pose dilemmas in some schools [Online].
Meade, J. (1991, January). Breaking ranks.
Mitchell, B.M. (1994). Weighted grades. Gifted Child Today (GCT), 17 (4), 28-29.
Siegel, J. & Anderson, C.S. (1991). Considerations in calculating high school GPA and rank-in- class. NASSP Bulletin, 75 (537), 96-109.
Talley, N.R & Mohr, J.I. (1993). The case for a national standard of grade weighting.
The Journal of College Admission, 139, 9-13.
Richards N., As Protests Wane, Prestigious School Swaps Grade System As Protests Wane, Prestigious School Swaps Grade System.